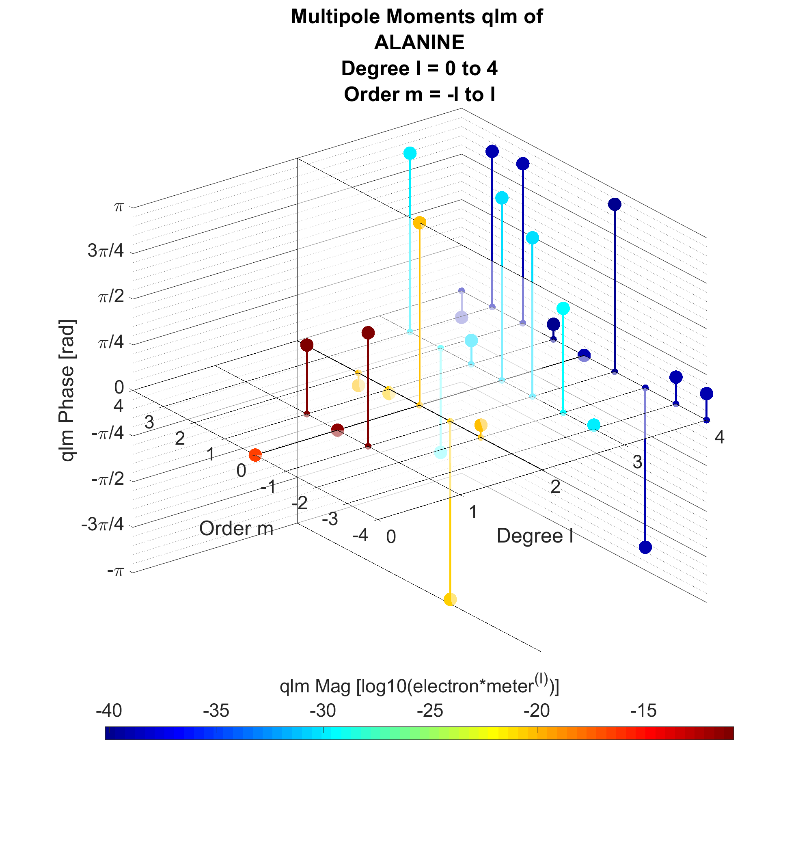
Inventors at Georgia Tech have created a computationally efficient method that computes the multipole moments of molecules and visually represents them as constellation diagrams in a 4D plot, as shown in the figure below. The invention is utilized after a user has successfully computated the partial charge distribution of a molecule in space with a computational chemistry software package. Afterwards, using numerical computing environments, orthogonal spherical harmonic basis functions are used to calculate the molecular multipole moments of the given molecule. The multipole moments are characterized by their degree, order, phase, and magnitude and plotted on the x, y, z axes, and colormap of the 4D constellation diagram. With the multipole moments, other electrostatic properties (electric field, electrostatic potential, etc.) may be calculated and plotted as well. This short run-time process results in an alternative method of utilizing high cost, complex molecular dynamics computer modeling (MD) to characterize the electrostatic properties of molecules. Additionally, users can now digitally encode the properties of molecules, such as those of ligands and receptors, using methods from telecommunications. For example, matched filter systems may be applied with the digitally encoded ligands and receptors to characterize molecular recognition.
- Low computational cost – reduces algorithm run-time via reduction in complexity of computing molecular electrostatic properties
- Digitally encoded molecular electrostatic properties – utilizes orthogonal basis functions
- Visual toolsets- to analyze molecular electrostatic properties and generates 4D plots of molecular electrostatic properties
- User friendly – compatible with any kind of partial charge distribution derivation (e.g. Mulliken, Merz-Kollman)
Molecular Modeling
- Characterizing and modeling binding and non-binding discovered, developed drugs and targeted receptors
- Currently practiced by pharmaceutical companies, biotechnological companies, academic institutions, research centers, and others
Telecommunications
- Communication topologies of analog, digital, optical, etc. systems
Understanding molecular recognition (MR) is one of the most important issues in molecular modeling and is applied by pharmaceutical companies, biotechnological companies, academic institutions, research centers, and others. Molecular modeling directly applies to the fast and accurate prediction of a drug ligand specifically binding to a target protein, a crucial step for leading drug discovery and development. The global market of molecular modeling was valued at $377 million in 2017 and is expected to register a CAGR of 15.46% from 2018 to 2023 [1]. Furthermore, software accounted for the largest market share of 63.1% in the year 2017 and was valued at USD 237.79 million in the same year. Unfortunately, MD is the common computational tool for molecular modeling, even though its simulations are computationally expensive, need further refinement, prevent routine simulations greater than a microsecond, and present other issues [2]. The invention, however, demonstrates potential implications of using both mathematical and visual representation of the molecular multipole moments in the prediction of the ligand-receptor binding path, site, and characteristics in the presence of intermolecular and environmental perturbations to the MR event.
References
[1] MarketWatch. (2019). Molecular Modeling Market 2019 Global Industry Demand, Recent Trends, Size and Share Estimation by 2023 with Top Players - MarketReportsWorld.com. [online] Available at: https://www.marketwatch.com/press-release/molecular-modeling-market-2019... [Accessed 11 Jul. 2019].
[2] Durrant, J.D. and J.A. McCammon, Molecular dynamics simulations and drug discovery. BMC Biology, 2011. 9(1): p. 71.